Real Time(q)PCR

Our real-time qPCR reagents offer high performance, reproducibility, compatibility, and affordability, providing the right tools to advance your research, whether your experiments are routine or complex.

What is Real Time PCR (q)PCR?

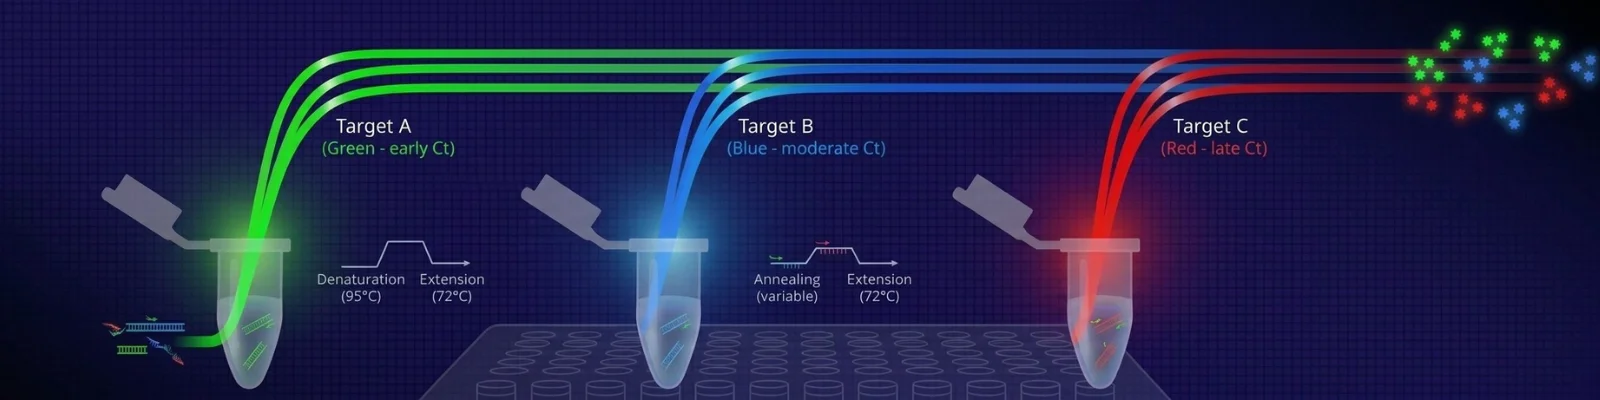
Real-time PCR (also known as quantitative PCR or qPCR) is a powerful and common technique for accurate analysis of gene expression. It is used to amplify and simultaneously quantify a targeted DNA molecule.

Unlike traditional PCR, which involves running an electrophoresis gel at the end to visualize the amplified products, real-time PCR enables the detection and quantification of nucleic acids during the PCR process.

This allows for the continuous tracking of the reaction’s progress and accurate quantification of the nucleic acids as they are being amplified.

Probe-based qPCR

Principle of Probe-Based qPCR

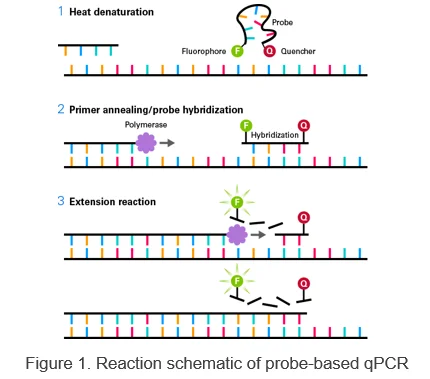
Oligonucleotides modified with a 5’ fluorophore (e.g., FAM) and a 3’ quencher (e.g., TAMRA) are added to the reaction. Under annealing conditions, the probe hybridizes in a sequence-specific manner to the template DNA.

Fluorescence of the fluorophore is suppressed by the quencher. During the extension reaction, the 5’→3’ exonuclease activity of Taq DNA polymerase degrades the hybridized probe, releasing quencher suppression and allowing fluorescence.

To maximize sensitivity, our kits use TaKaRa Ex Taq DNA Polymerase Hot-Start Version, a hot-start PCR enzyme that minimizes nonspecific amplification.

Advantages of Probe-Based qPCR

  • The use of highly specific probes ensures accurate detection of target sequences with minimal interference.
  • Multiplexing Capability: Unique labeling of each probe allows for the simultaneous amplification of multiple targets in the same reaction tube.
  • Multiplexing minimizes the need for multiple reactions, reducing handling and preparation time.
  • The probes can precisely discriminate between SNPs and CNVs.

Disadvantages of Probe-Based qPCR

  • Developing and optimizing probes can be time-consuming.
  • Probes are more expensive than simple oligonucleotide primers.
  • Pre-designed probes can have even higher costs.

Principles of Green Intercalating Dye-Based qPCR

Fluorescent detection using intercalating dyes

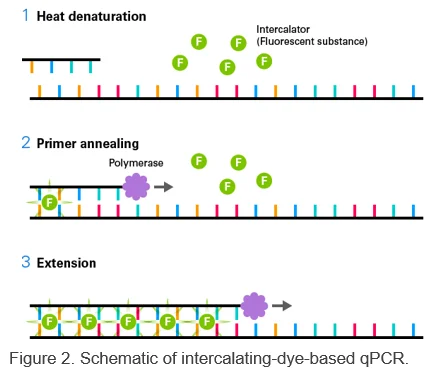
This method uses a DNA intercalator (e.g., TB Green) that emits fluorescence when bound to double-stranded DNA.

Monitoring fluorescence allows for quantification of amplification products.

Following amplification, performing a melt curve analysis provides information on the specificity of your PCR products.

To maximize specificity and sensitivity, our kits use Takara Ex Taq DNA Polymerase Hot-Start Version.

Advantages of Dye-Based qPCR

  • Uses standard unlabeled oligonucleotides, making it less expensive.
  • Requires less optimization compared to probe-based qPCR.
  • Suitable for high-throughput screens and large-scale studies.
  • Provides sensitive detection for gene expression studies.

Disadvantages of Dye-Based qPCR

  • The dye binds to all double-stranded DNA including nonspecific products.
  • Melt curve analysis is often required.
  • Users generally need to design and validate their own primers.

One-Step Real-Time qPCR

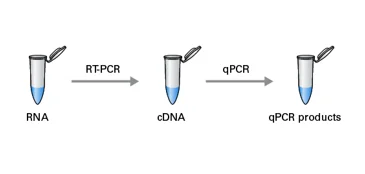
When starting with RNA samples, one must first perform a reverse transcription (RT) step to generate cDNA.

Advantages

  • Simple and rapid workflow
  • Compatible with large numbers of samples
  • Adaptable to high-throughput workflows

Limitations

  • Cannot optimize RT step
  • Does not generate stock cDNA
  • Not ideal when analyzing large numbers of target genes

Two-Step Real-Time qPCR

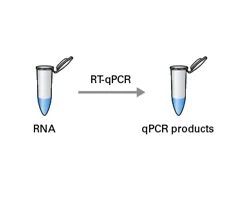
Two-step RT-qPCR performs the RT step in one tube and the qPCR reaction in a separate tube.

Advantages

  • Compatible with limited sample input due to high sensitivity
  • Able to optimize RT and qPCR steps separately
  • Can generate cDNA stocks

Limitations

  • More time-consuming
  • Less amenable to high-throughput workflows

What is UNG/UDG?

Uracil-DNA glycosylases (UDGs) are highly conserved enzymes involved in DNA repair across evolution.

UDG and UNG are often used interchangeably, as they both serve the same function in qPCR by preventing carryover contamination.

Preventing contamination is crucial in qPCR, as even trace amounts of DNA can lead to false positives.

To address this, UNG can degrade amplification products from prior PCR runs while leaving the original template intact.

To prevent carryover contamination in qPCR, use a master mix containing UNG or UDG.

What are the differences between absolute and relative quantification?

Absolute quantification determines the absolute number (i.e., number of copies) of a target using a standard sample that has a known number of copies.

Relative quantification allows a relative comparison between samples. Typically, a target gene and a reference gene are simultaneously assayed for normalization.

Relative quantification provides the difference in expression level in the unknown sample compared with the control sample.

```

One-Step RT-qPCR Uses gene-specific primers for reverse transcription and allows highly sensitive detection of a specific gene. Allows for the preparation of total cDNA by reverse transcription using universal primers that recognize all mRNA molecules, such as random hexamers or oligo-dT primers. The resulting cDNA can be used for the detection of a variety of transcripts. When there is an overabundance of total RNA in the reaction: Can provide highly efficient amplification even in the presence of large amounts of total RNA. Using random 6-mers for reverse transcription may result in poor reaction efficiency due to insufficient primer availability. In this situation, we recommend using oligo-dT primers for two-step RT-qPCR rather than random 6-mers. The use of oligo-dT primers may improve efficiency and provide similar results as compared to one-step RT-qPCR. Procedure strengths: Analyzing a single gene. Analyzing the expression of a large number of genes. For high-throughput analyses of many samples or precise detection of rare transcripts, a one-step RT-qPCR protocol is recommended. An additional advantage of one-step RT-PCR is the existence of single-tube workflows, avoiding the need to add additional reagents halfway through the procedure and thus lowering the risk of contamination.

Calibration curves for RT-qPCR may be prepared by either of the following methods: Serial dilution of RNA, followed by reverse transcription and real-time PCR Serial dilution of cDNA (obtained by reverse transcription reaction), followed by real-time PCR Since the two methods evaluate different parameters, it is important to choose a method appropriate for the experimental system being used. Calibration curves prepared from diluted RNA samples reflect differences in not only PCR amplification efficiency, but also differences in reverse transcription efficiency, which is dependent on the amount of RNA. PCR amplification efficiencies determined from such calibration curves may potentially differ from the actual efficiency. For Absolute Quantification, the reverse transcription efficiency is critical. Therefore, use serially diluted RNA to prepare calibration curves (cDNA dilution is unsuitable). For Relative Quantification, differences in reverse transcription efficiency can be corrected by assaying a reference gene, such as a housekeeping gene. The use of serially diluted cDNA is recommended for preparing calibration curves.

To avoid amplification of genomic DNA in total RNA samples: Design primers that avoid genomic amplification: select a large intron region and design forward and reverse primers in exons upstream and downstream of the intron. With this strategy, genomic amplifications cannot occur for large introns. When introns are small, genomic amplification can be differentiated based on differences in melting temperature as the result of different amplification sizes (melt curve). For genes that lack introns or when the genomic structure is unknown, treat the total RNA with DNase I to remove genomic DNA. Target gene expression levels are often normalized to the expression of a “housekeeping gene” (reference gene) to correct for differences in the amount of input RNA and variations in reaction efficiency. How do I select a suitable housekeeping gene? There is no single, universally appropriate housekeeping gene suitable for accurate normalization in every experimental condition, as it is important to select housekeeping genes that do not vary in expression levels in the experimental system used. Common housekeeping genes that have been used in the past include GAPDH and β-actin; however, reports in recent years indicate that expression of these genes may also vary, depending on the sample type and/or experimental conditions. Using multiple housekeeping genes for normalization is currently the most reliable approach. In this strategy, the expression of multiple housekeeping genes is assayed, and the genes that show the lowest level of variation are selected for use. Software has been developed for selecting the optimum genes for correction (e.g., geNorm and BestKeeper). Inferences may also be made from microarray or RNA-seq expression profiling data, if available.

Suitable standard samples are those that approximate the actual sample as closely as possible. For gene expression analysis studies, use cDNA prepared from samples collected under conditions in which the target gene is known to be expressed. For genomic analysis studies, use genomic DNA. Artificial standard samples (e.g., plasmid DNA) are not recommended. Even when the sequence of the amplicon is identical, any substantial difference in the template composition may result in variable PCR amplification efficiencies (e.g., genomic DNA vs. plasmid DNA).

When using a validated primer, previous melt curve analysis (Tm values) can serve as a reference. If the Tm value is the same as observed in the past, it is reasonable to assume that the PCR product is the same as that obtained in the past. Keep in mind, however, that although identical PCR products will show the same Tm value, obtaining identical Tm values alone does not necessarily confirm that the PCR products are identical. An independent confirmation method should be used; when using a primer for the first time, please perform electrophoresis to confirm that the amplification product of the real-time PCR is the intended size.

The necessary number of sample replicates (n) varies depending on the experimental system. In principle, when the experimental error is expected to be relatively large, use a larger number of samples: When profiling gene expression by RT-qPCR, it is useful to prepare multiple biological replicates and perform multiple RNA extractions in order to ascertain the degree of biological variability. With respect to qPCR, greater variability is expected when using a low level of template because the number of cycles required for detection will be high. In such cases, use a larger number of replicates.

The sensitivity of qPCR varies depending on experimental conditions such as the reagents and primers used. Appropriately designed systems have demonstrated the ability to detect as few as ~10 copies of template.

The Ct value can be determined by two different methods: The crossing point method defines the Ct value as the crossing point between the amplification curve and the threshold line. The second derivative maximum method defines the Ct value as the point of the maximum of the second derivative of the amplification curve (second differential curve). The latter method allows highly precise analyses, since the Ct value is fixed by setting a threshold and is not subject to the effect of instrument-specific detection variability. Please note that some instrument systems do not allow one to choose between the crossing point method and the second derivative maximum method.

Absolute quantification determines the absolute number (i.e., number of copies) of a target using a standard sample that has a known number of copies. Relative quantification allows a relative comparison between samples. Typically, using relative quantification, a target gene to be quantified and a reference gene (e.g., a housekeeping gene) are simultaneously assayed for the purpose of correction (normalization). Relative quantification provides the difference in expression level in the unknown sample compared with the control sample.